Service Status
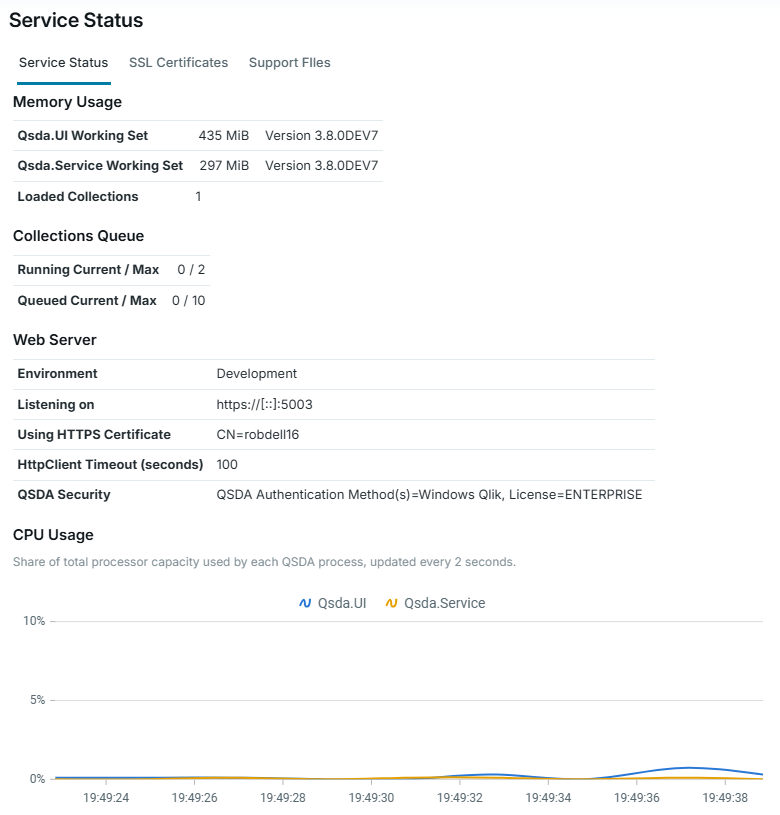
The Service Status screen shows the current state and configuration of the QSDA server:
- Memory Usage - The working set and version of each QSDA service, and the number of Loaded Collections.
- Collections Queue - Current and maximum running and queued collections.
- Web Server - The address the UI is Listening on, the HTTPS certificate in use (when using HTTPS), and the HttpClient Timeout (seconds).
- QSDA Security - The enabled QSDA authentication methods and the license tier.
- CPU Usage - A live chart of the processor share used by the Qsda.UI and Qsda.Service processes, updated every 2 seconds and covering the last 2 minutes. Each value is a share of the machine's total processor capacity, as Task Manager reports it, so one fully busy core on an 8-core machine shows as 12.5%. The chart updates only while the screen is open; the Qsda.Service line has a gap while the service cannot be reached.