Analysis Score
The Analysis Score is a benchmark designed to quantify the quality and health of a Qlik application based on the QSDA pro analysis.
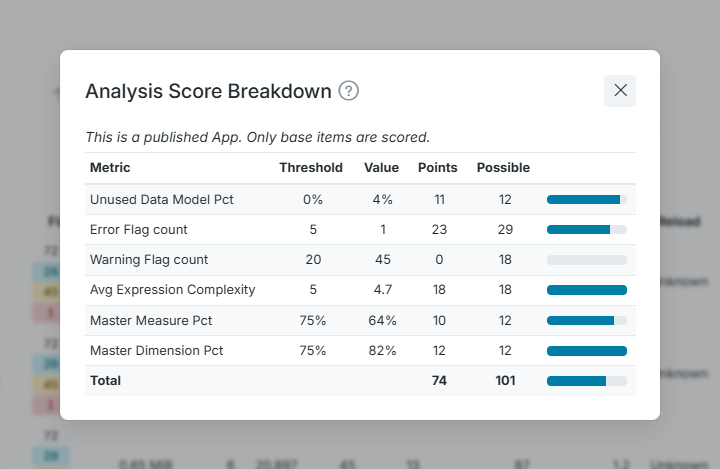
Relative App Score is constructed of six metrics:
-
Unused Data Model (Percentage): Identify waste and potential performance overhead within the data model.
-
Error Flag Count: Immediate view of the App's technical stability.
-
Warning Flag Count
-
Average Expression Complexity: Tracks how difficult the App's logic is to maintain or how likely it is to impact engine performance.
-
Master Measure Percentage: Percentage of visualization measures that use a Master Measure.
-
Master Dimension Percentage: Percentage of visualization dimensions that use a Master Dimension.
The Master Item percentages evaluate how well the App utilizes reusable Master Items, which is a key indicator of governed, scalable development.
For a published App, only base items are scored; community and private content is excluded. For an unpublished App, all items are scored. The score breakdown states which scope applies.
The final score is a weighted calculation where the sum of earned Points is compared against the total Possible points. Administrators can define a weighted scoring model on the Project Config page.
In the specific example above, the App earned 45 out of 101 possible points. For instance, Master Measure Pct measures what percentage of the App's total measures are Master items compared to the target threshold of 75%. Given a low actual percentage of 3%, this metric adds 0 points towards the overall App Score.