App List Page
Select a connection to list the Qlik apps available for analysis. If you have only one connection defined, QSDA selects it automatically.

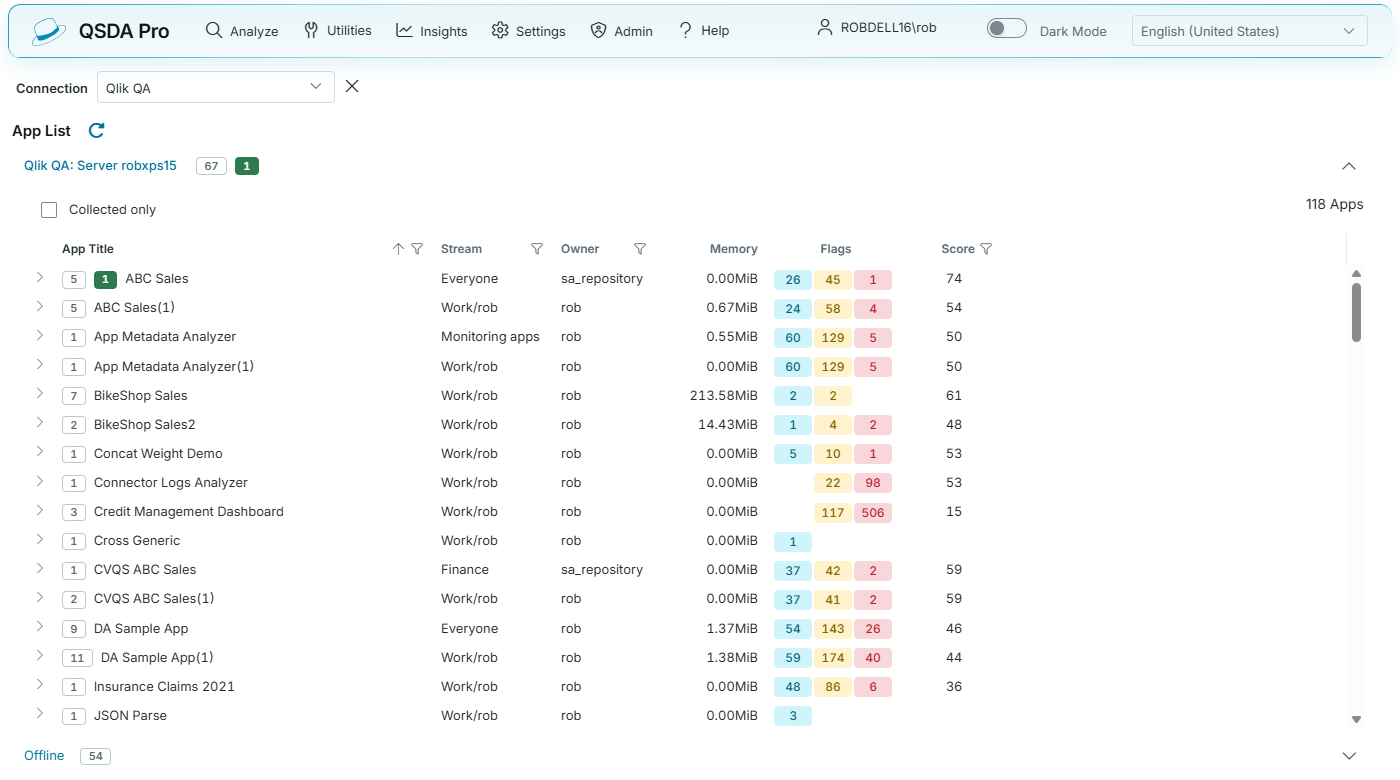
Connection
Use the Connection dropdown to select a Qlik connection. Create connections on the Admin > Connections page. QSDA retains your connection selection while you use the application.
App List
The top section lists apps from the selected connection. When enabled in the configuration, the Offline section lists apps with saved collections that are not in the current app list. If only imported collections are enabled, this section is labeled Imported.
Use Collected only to show apps that have collections. Click the refresh icon beside App List to refresh the list.
For a connection that uses interactive login, the section header includes a QlikUser link with the current user name. Click it to open the Change Connection User dialog, then click Login as a different user. Log out of any active Qlik Sense tabs first.
The app grid has these columns:
| Column | Content |
|---|---|
| App Title | App name, with its collection-count badges. |
| Stream or Space | Space for Qlik Cloud connections; Stream for other connections. |
| Owner | App owner. |
| Memory | App size in MB. When the app exceeds the Quota threshold fraction of the tenant's app memory quota, the size appears as a warning badge; hover over it for the percentage. See Project Options. |
| Flags | Flag badges from the app's latest collection. |
| Score | Analysis Score of the app's latest collection. Shown only when analysis scores are displayed. |
Collection-count badges appear beside app names and in the section headers:
- Gray outlined badges count collections that are not loaded in memory but remain available in the QSDA repository. Use Load to prepare a saved collection for viewing.
- Solid blue badges with white text count collections that are queued or in progress, including metadata collection, chart calculation, and analysis.
- Solid green badges with white text count completed collections, including those with Ready or Error status. A red dot on the green badge indicates that one or more collections have an error. Expand the app to check each collection's status and error message.
The unloaded and completed counts can overlap: a completed collection can also be unloaded. Hover over a badge to see its count description.
Selected App Section
Expand an app to view its existing collections. For an app in the selected connection, you can also open the options for a new analysis.
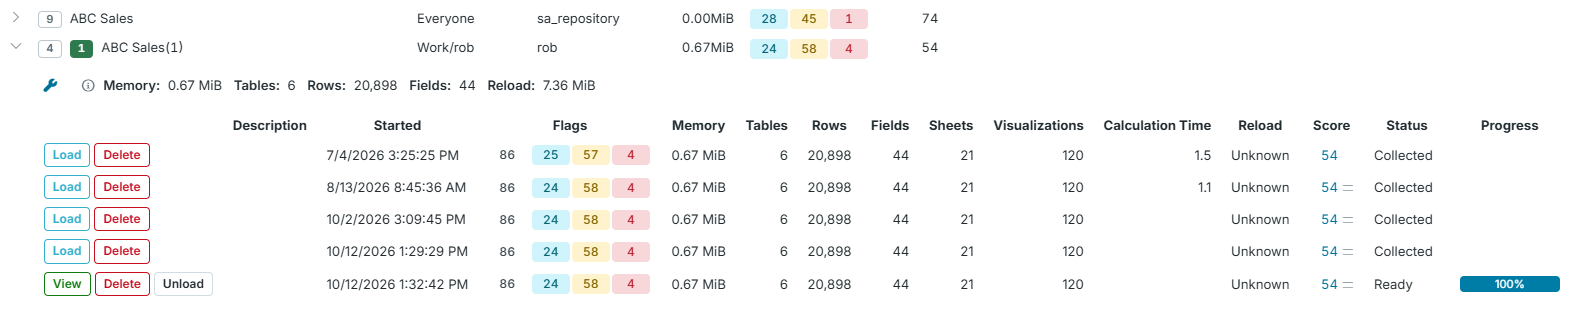
The collection table shows Description, Started, Flags, Memory, Tables, Rows, Fields, Sheets, Visualizations, Calculation Time (seconds), Reload (peak reload memory), Score, Status, and Progress while a collection is loaded or running. Error messages appear after the status. On narrower windows, the columns from Memory through Score are hidden. The Score column is filled only when analysis scores are displayed; click a score to open its score breakdown.
Launch a new analysis
- Expand an app in the selected connection's list.
- Click the wrench icon to open the New Analysis card.
- Adjust the analysis options below.
- Click New Analysis to start collecting and analyzing the app.
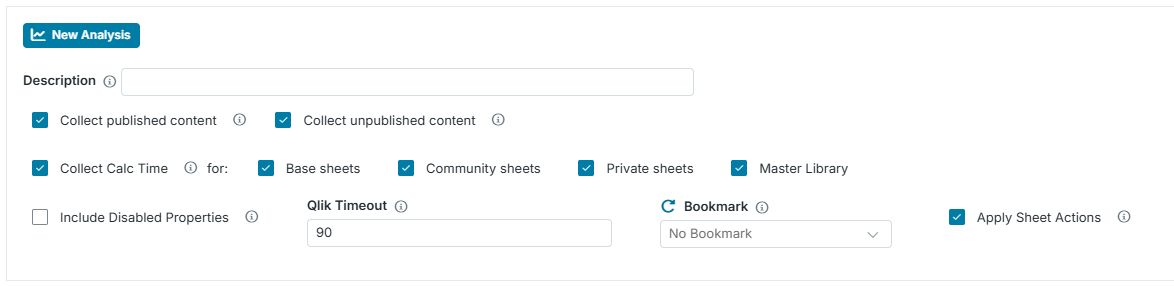
Analysis Options
- Description — Brief text to identify this analysis, such as "Baseline" or "After drop fields".
- Collect published content / Collect unpublished content — For a published app, select which content to collect. Unpublished apps collect all content.
- Collect Calc Time — Clear this option if you do not need chart calculation times. Disabling it can greatly speed up collection. For published apps, enabling it displays scope options for Base, Community, and Private sheets and Master Library visualizations. These options control which charts are timed; they do not replace the content collection options above.
- Include Disabled Properties — Select this option to collect disabled properties. QSDA normally excludes them because they have no impact on the app.
- Qlik Timeout — Maximum number of seconds to wait for each Qlik operation to complete, such as a chart calculation.
- Bookmark — Select an app bookmark to apply before calculating charts. Clear the selection to use No Bookmark. Use the refresh icon beside Bookmark to refresh the available bookmarks.
- Apply Sheet Actions — Select this option to execute sheet actions before calculating sheet objects and checking expression syntax. Enable it only when needed, because it slows down collection.
Manage existing collections
Expand an app to see the status, progress, and available actions for each collection:
- View — Open the Summary page for an analysis. Available when the collection is loaded and its status is Ready.
- Load — Load a saved collection from the QSDA repository and prepare it for viewing.
- Unload — Remove a ready analysis from memory to free resources. The saved collection remains in the repository, and you can load it again later.
- Cancel — Stop a collection that is in progress.
- Delete — Permanently delete a collection from memory and the repository. You cannot undo this action.