Design KPIs
On the Summary page, click the Design KPIs tab beside the Summary tab.
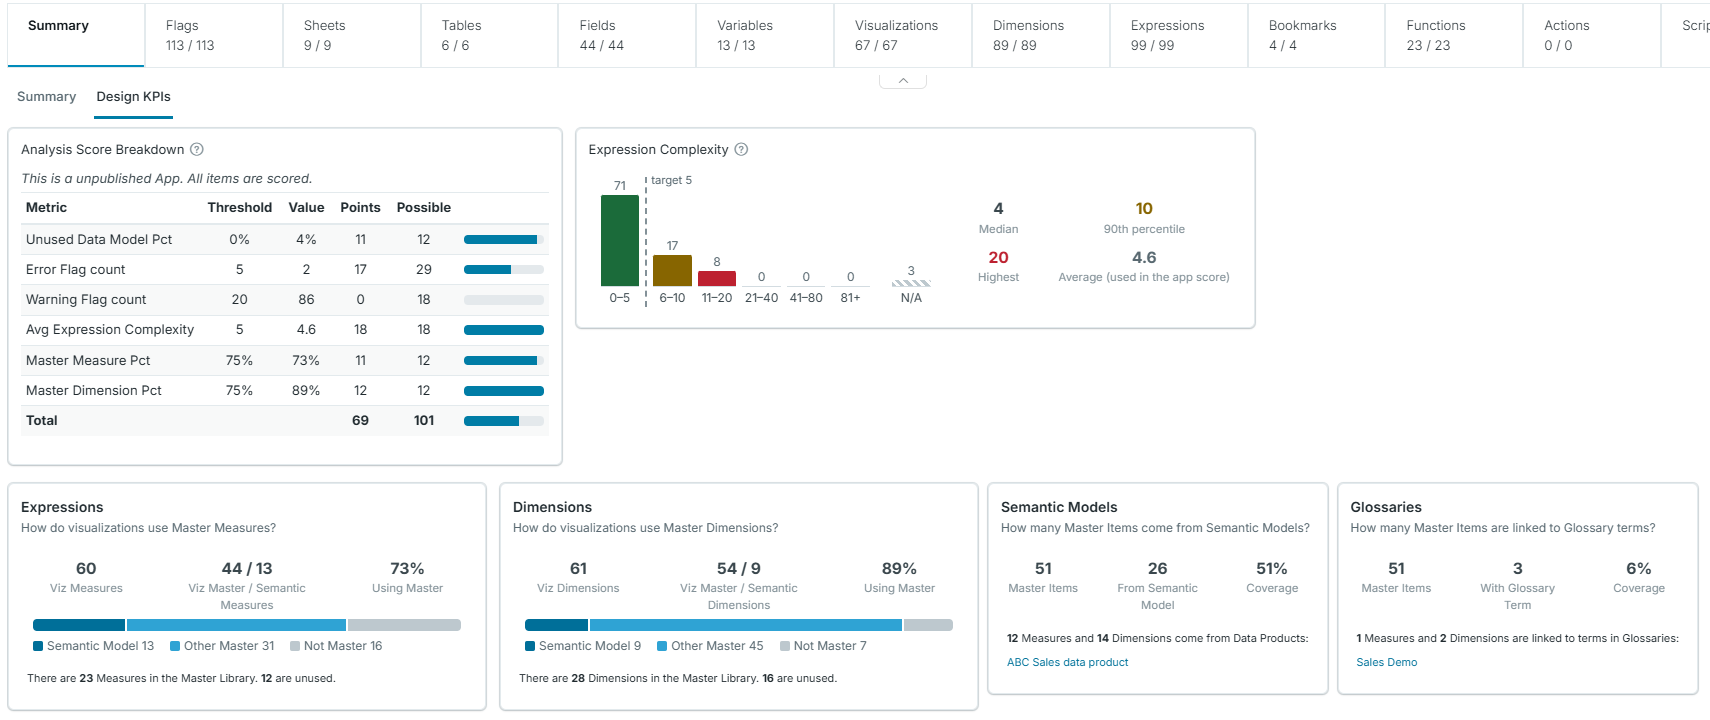
The Analysis Score Breakdown shows how the Analysis Score was calculated.
The Expression Complexity histogram visualizes the range of expression complexity. Score ranges are based on the Expression Complexity Score target in Analysis Scoring and are colored Simple, Moderate, or Complex. The median, 90th percentile, and highest scores show the most complex expressions, which the average used in the app score can hide.
The Expressions and Dimensions cards show how visualizations use Master Measures and Master Dimensions.
If the App script loaded Dimensions or Expressions from a Semantic Model, the Semantic Model card will be displayed.
If any Dimensions or Expressions are linked to a Business Glossary, the Glossaries card will be displayed.